Thermal Conductivity of Freeze-dried Model Food Gels
This document was submitted by our user and they confirm that they have the consent to share it. Assuming that you are writer or own the copyright of this document, report to us by using this DMCA report button.
Thermal
Conductivity
of
SUMMARY The thermal conductivities of freeze-dried slabs of starch, gelatin, pectin, cellulose gum, and egg albumen gels were determined under a variety of conditions, using a guarded hotplate apparatus. The effects of temperature, gas pressure, and gas composition on a starch gel were studied in detail. The thermal conductivities of dry materials at atmospheric pressure varied from 0.921 X 10m4 cal cm-l to 1.337 X lo-’ (cellulose “C” secel (gelatin) gum). In vacuum this variation was from 0.218 x 10” (starch) to 0.467 x lo4 (cellulose gum). The difference between atmospheric pressure and vacuum was equal to the thermal conductivity of air for all the materials except cellulose gum, which gave a greater difference. The thermal conductivity of starch gel increased linearly with increasing temperature from 0 to 7O”C, and decreased with decreasing pressure, as porous materials normally do, to a constant value below 0.1 mm Hg. A helium atmosphere gave a higher thermal conductivity than air or nitrogen. The thermal conductivity was higher in all freeze-dried gels containiug adsorbed water than after the removal of all the water. The thermal conductivity of pectin gels increased with the density. Thermal conductivity was affected by the type and size of pores of the dried materials. In general, changes in thermal conductivity were significant with pressure, type of gas, and nature of the material, particularly the fibrous structure, but less important with temperature and amount of adsorbed water. INTRODUCTION
The freeze-drying rates of some food-like gels were recently studied under a variety of experimental conditions (Saravacos, 1965). Comparatively high drying rates were obtained in normal vacuum when adequate heat was supplied to the test materials. Model gels can be used as experimental materials for the study of heat and mass transfer in freeze-drying, because of the uniform composition, structure, and dimensions of the ’ Present address: Department of Food Science and Technology, New York State Agricultural Experiment Station, Geneva, N. Y. 14456.
Freeze-dried
Model
Food
Gels
samples. It is thus possible to make more useful measurements than on actual food materials, which inherently have a more complex composition and structure. In normal freeze-drying, after the sublimation of surface ice, heat must be supplied to the interior through a porous dried layer. It has been known that porous materials are poor conductors of heat, particularly at the low pressures usually employed in freezedrying. Harper (1962) used heat-flow transducers to measure the conductivity of freezedried peach, apple, and beef. More recently, Harper and El Sahrigi (1964) studied the thermal conductivity of freeze-dried beef, apple, pear, and a polyurethane foam in various gas atmospheres and p r e s sure s . Thermal conductivity was found to decrease from a constant value at atmospheric pressure to a lower value at pressures below 0.1 mm Hg, the difference between the two values being close to the thermal cot~cluctivity of the gas in the pores of the material. Lusk et nl. (1964) calculated the thermal conductivities of freeze-dried fish from drying-rate data, and reported similar values. Little work has been reported on the effect of temperature, moisture content, and sample composition on the thermal conductivity of freeze-dried food materials. The present work was done to show the effect of a variety of experimental conditions on the thermal conductivity of freeze-dried food g-els, using apparatus of high accuracy. EXPERIMENTAL MATERIALS AND METHODS Freeze-dried gels. The following gels were used: potato starch, gelatin, pectin, pectin and ghcase (l/l), cellulose gum (carboxy-methyl-cellulose), and egg albumen. The gels were prepared by d:spersing 25 g of the dry powder in 250 ml of distilled water and heating until boiling, when a viscous solution was formed. The hot gels were poured into a circular brass mold of 17 cm diameter. The resulting slabs had a thickness close to 1 cm. The egg albumen gel was prepared b;ji heating a solution of separated egg whites in the mold until gelation. Pectin gels of different conce&%tion
s 773 I
774
THERMAL
CONDUCTIVITY
OF FREEZE-DRIED GELS
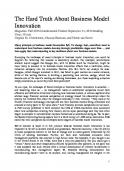
(5%, lo%, and 5% pectin-S% glucose) were Prepared in order to obtain dried gels of various densities. The gels were frozen in the mold by contact with powdered dry ice; then they were quickly freeze-dried in a laboratory glass freeze-dryer. The freeze-dryer consisted of an 8-L vacuum desiccator connected to a SOO-ml dry ice-ethanol condenser and a vacuum pump maintaining an average pressure of 0.1 m m Hg. The heat of sublimation was supplied by radiation from the environment, and drying was completed within 48 hr. The samples shrank slightly during drying, and the freeze-dried gels had an average water content of 2%. Before thermal conductivity was measured, all the dried gels except the starch were equilibrated to a constant moisture content by placing the samples in an evacuated desiccator containing a saturated solution of sodium dichromate. This solution maintained 52% RH at room temperature, and the corresponding water content was l-15%, as indicated by the sorption isotherms of the freeze-dried gels (Saravacos, 1965). The starch gels were equilibrated to normal summertime room humidity, and the quantity of adsorbed water was approximately the same as that of the other gels. The density of the freeze-dried gels was calculated from the weight of the circular slabs (equilibrated at 52% RH) and their dimensions. The porosity, defined as the ratio of the volume of pores to the volume of the dried sample, was determined by a simple air-displacement procedure (Harper, 196’2) : a measured air pressure (380 m m Hg, above atmospheric) was introduced into a loo-cc glass cell-containing the sample ; the pressure was then released, and the volume of the air discharged was measured. This procedure was repeated on the empty cell, and the porosity was obtained by a simple calculation. The pore ‘size of the freezedried gels was measured with a microscope (x400) equipped with a calibrated eye-piece and incident illumination. The range of the pore diameters was determined by examining several microscopic fields, Apparatus and procedure. The thermal conductivities were measured under steady-state conditions in a guarded hot-plate apparatus (Hoge et nl., 1962), shown schematically in Fig. 1. A sample 16.5 cm in diameter and about 1 cm thick was placed between the hot and cold plates. The guard ring, concentric with the hot plate, and a shield above it were maintained at the same temperature as the/hot plate, so the only heat flow from the hot plate was through the sample. The bottom of the cylindrical vacuum-tight container served as the cold plate. In the cover of the container were means for changing the position of the hot-plate assembly to bring it in contact with the
Diffusion pump i===i
5
hmastot 0 c3 c2idiA Vacuum pump
McLeod
Monomele oil
/ S0mpk
Fig.
Hot plot1-
1. Thermal-conductivity
\
‘\\
Cold plate
apparatus.
sample, connections to evacuate the container, and connections for electrical leads. The cold-plate temperature was maintained constant by immersing the whole apparatus in a thermostated oil bath. The temperatures were measured with copper-constantan thermocouples, and a precision potentiometer was used for both temperature and power measurements. To ensure steady-state conditions, a single thermal-conductivity measurement lasted about 6 hr. The absolute accuracy of the apparatus is estimated to be within 2%. This was confirmed by measuring standard materials calibrated by the National Bureau of Standards. Reproducibility for a single sample is within %%. The largest observed difference between different samples of the same model food gel measured under the same conditions was 3.6%. The thermal conductivity
is given by the relation,
w AX k=-x--A AT. where W = the power input, watts; A = the hot plate area, sq cm; AX = the thickness of sample, cm; AT = the temperature difference, “C. Thus, k is obtained in watt cm-’ “Cl, and multiplying by 0.2389 converts it to cal cm-l “C-l se?. Except for the temperature curve (Fig. 2) with the starch gels, all measurements were made with the cold plate at about 36°C. This temperature was chosen as the lowest that could be accurately controlled at any possible room temperature without cooling. A 10°C temperature difference was maintained across the sample. After a sample had been measured at atmospheric
SARAVACOS
AND
PILSWORTH
775
i io.7 i
yO.6.
i 5 0.5 Z 00.4 0.61 -,a
0.3 0
10
20
30
TEMPERATURE,
40
50
60
70
80
‘C
Fig. 2. Effect of temperature on the thermal conductivity of freeze-dried starch gel (atmospheric pressure). pressure the apparatus was evacuated and pumped continually for at least 24 hr with the sample at about 60°C. It was assumed that this treatment effectively removed all adsorbed water from the sample. The cold-plate temperature was then dropped to 36”C, and k was measured while maintaining the low pressure. Because of traces of water vapor or other volatiles, the lowest pressure that could be maintained was about 0.03 m m Hg. Dry air was then admitted to the apparatus, and a final measurement of k was made at atmospheric pressure. Investigation of the effects of temperature, pressure, and sample preparation on starch gels was more detailed. Three different samples were prepared separately, and the thermal conductivity was measured at various temperatures (Fig. 2). The samples were either equilibrated to room relative humidity or dried completely. The sample of starch gel which was measured at the greatest number of temperatures (No. 3) was used for the measurements involving pressure variations. The sample was first equilibrated to normal room relative humidity, and the thermal conductivity was measured at a series of different pressures, evacuating a part of the remaining air after each measurement (Fig. 3). There was some uncertainty in these measurements because of drying out of the sample and the presence of water and possibly other vapors as well as dry air in the atmosphere of the apparatus. The pressures given were observed with manometers, using mercury for the higher pressures and oil for the lower. At the lowest pressures even the oil manometer did not give very high accuracy, but the curve had leveled off so the exact pressure value was not critical. A McLeod gauge was also used, but it gave somewhat lower pressures, possibly because of the condensation of water
x0.2
0.1 0
.Ol
’ ’111111 ’ ’111111 ’ ’I’h 0.1 1.0 PRESSURE
I ’l’llll
IO m m Hg
100
’ lib
1000
Fig. 3. Effect of pressure on the thermal conductivity of freeze-dried starch gel (mean temperature, 41°C). vapor in the gauge. At the lowest possible pressure the temperature was raised to above WC, and pumping was continued for at least 24 hr to remove as much of the water as possible. The pressure was then increased in steps by the introduction of dry air, and the thermal conductivity was measured at each step. The thermal conductivity in a gas atmosphere was measured by introducing dry gas (nitrogen or helium) from a cylinder into the evacuated sample container. RESULTS
AND
DISCUSSION
Table 1 shows the results of measurements of thermal conductivity of seven different freeze-dried gels at a mean temperature of 41°C both at atmospheric pressure and in vacuum. The thermal conductivities of the bone-dry materials at atmospheric pressure varied from 0.915 x 10m4 cal cm1 “C-l see-l (5% pectin) to 1.337 X 10m4 (cellulose gum). In engineering units this variation is from 0.0221 to 0.0323 Btu ft-l “F-l hr-l. The thermal conductivity of all samples increased to a small degree when water vapor (1%lS%, dry basis) was adsorbed by the gels. This increase was lowest (2%) in the 5% pectin gel and highest (12%) in cellulose gum. The values of the thermal conductivity of freeze-dried gels were somewhat lower than those of freeze-dried foods (Harper, 1962; Lusk et al., 1964). The difference
THERMAL
776
CONDUCTIVITY
Table 1. Thermal conductivity ~-~--~
OF
FREEZE-DRIED
GELS
of freeze-dried model food gels (mean temperature Thermal
conductivity
Atmospheric Freeze-dried slab (prepared from gels contaimng 10% solids) ~~
Thickness (cm) -____-
Potato starch Gelatin Cellulose gum Egg albumen Pectin 10% Pectin 5 % Pectin 5%-glucose 5%
at
__-
--
0.813 0.943 0.796 1.119 1.310 0.980 0.931
‘At room RH. Note: To convert to Btu ft” “I?
Density SZc/,RH (g/cc)
0.109 0.083 0.150 0.077 0.066 0.039 0.110 h?,
multiply
may reflect the lower total solids content in wet gels (10%) than in raw foods (meat, fruit). Another possible factor may be the variation in porous structure encountered in freeze-dried gels and foods. This is discussed later in this paper. A significant decrease in thermal conductivity was found when the pressure was lowered from atmospheric to 0.03 mm Hg. Except with cellulose gum, the difference between the high and low pressure values was close to 0.653 X 10m4cal cm-l ‘C-l see-l, which is the thermal conductivity of air at the same temperature. In cellulose gum this difference was significantly higher. Table 2 shows the effect of gas atmosphere on the thermal conductivity of a freeze-dried starch gel. Air and nitrogen gave about the same thermal conductivity, while helium resulted in a significant increase. The difference of the k values between atmospheric pressure and vacuum was close to the thermal conductivity of the gas contained in the pores for both air and nitrogen, but it was significantly less for helium. Similar results Table 2. Thermal conductivity of freeze-dried starch gel (bone dry) in various gases at 1 atm. pressure (mean temperature, 41 “C) . __-Thermal
Gas Air
Nitrogen Helium Vacuum
Gas-filled (x10-4)
0.940 0.935 3.571 0.218
conductivity gel
(cal cm-
Difference from vacuum (X10-4)
0.722 0.717 3.353
“C-1 se-l) Pure gas (X10-“)
0.653 = 0.648 a 3.684’
a Hilsenrath et al., 1955. Tables 2-9, 7-9. ’ Nuttall, 1950.
At
(ml
pressure
52% RH (X10-4)
~ox;egd;y4
0.980” 0.987 1.499 0.999 1.133 0.935 1.196
0.940 0.921 1.337 0.938 1.048 0.915 1.150
41°C).
cm-’ ‘C-1
see-l) VXUUlIl Bone dry (X10-‘)
-0.218
0.352 0.467 0.309 0.416 0.287 0.428
the above values by 241.9.
were obtained on freeze-dried foods by Harper and El Sahrigi (1964), who developed a semi-theoretical relationship expressing the thermal conductivity as a combination of the individual solid and gas conductivities. Fig. 2 shows that, within the accuracy of the measurements, the thermal conductivity of starch gels increased linearly with the temperature between 0 and 70°C. The agreement for the three samples was good, considering the possible effects of sample preparation (smoothness, uniform thickness) and the accuracy of the apparatus. The thermal conductivity of freeze-dried starch gel at various pressures is shown in Fig. 3. At all pressures the thermal conductivity of the gel containing adsorbed water (dotted line) was higher than the k of the bone-dry gel (solid line). The thermal conductivity had an almost constant value between 760 and 100 mm Hg, and a lower almost constant value at pressures lower than 0.1 mm Hg. A sharp decrease in 1~ was found as the pressure was reduced from 100 to 1 mm Hg. The variation of the thermal conductivity of the dried gels with pressure is related to the change of k of the gas contained in the pores of the material. The sigmoid shape of the thermal conductivity-pressure curve has been found to be characteristic of gas-filled porous solids, as, for example, in textile materials (Hoge and Fonseca, 1964). The thermal conductivity of pectin gels was found to increase as the density was increased (Fig. 4). The sugar-containing pectin gel had a higher density and a higher
SARAVACOS
AND
777
PILSWORTH
ture in the freeze-dried material. Starch, gelatin, and egg albumen gels had more or less spherical small pores, while cellulose x10-4 0 Pectin 5 % h Pectin 10% gum and the pectin gels consisted of bundles Pectin 5 % 1.5 of thin fibers running across the sample. The + glucose 5% 7 relatively high thermal conductivity of cellus lose gum can be explained on the basis of i the high density of the freeze-dried gel, and 2 the fraction of the microscopic fibers which Fi were oriented parallel to the heat flow. The i fibrous structure of pectin gel (10% sample) was possibly responsible for its higher thermal conductivity than starch and gelatin gels, both of which had higher densities. Freeze-dried beef has been found to have a thermal conductivity higher than apple or peach, and this may be attributed to its 0.150 0.05 0.00 0 lower porosity and more fibrous structure. DENSITY (Q/CC 1 The freeze-drying rates which were obFig. 4. Effect of density on the thermal conductivity of freeze-dried pectin gels (mean temserved on model gels (Saravacos, 1965) can perature, 41°C). be partially explained on the basis of the thermal conductivity than the simple pectin thermal conductivities of the dried materials. gel which initially contained the same amount Cellulose gum dried more rapidly than any of total solids (10%). The porosities and of the other gels, which can be related to the the pore dimensions of the dried gels are high thermal conductivity of the dried mashown in Table 3. The porosities varied terial. Starch, gelatin, and pectin gels dried from 0.89 to 0.98, considerably higher than at approximately the same rate and had similar thermal conductivities. Egg albumen those of freeze-dried foods (0.76 to 0.87) was the slowest-drying gel, but its thermal reported by Harper and El Sahrigi (1964). At the same time the average pore diameters conductivity was not particularly low. In were much smaller in the gels (1-15~) than this case the limiting factor may be the slow in freeze-dried foods (30-300 p). It is transfer of water vapor during freeze-drying. possible that these differences are due to REFERENCES the low initial gel concentration and the Harper, J. C. 1962. Transport propertiesof gases rapid freezing rate before drying. Luyet in porous media at reduced pressures with (1962) found that freezing meat rapidly, reference to freeze-drying. A. I. Ch. E. Jo~mal produced pores of an average diameter less 8, 298. than 10 p in the freeze-dried material. Rapid Harper, J. C., and A. F. El Sahrigi. 1964.Thermal freezing produces small crystals, which upon conductivities of gas-filled porous solids. Ind. sublimation give rise to a microporous strucEng. Chem. Fzmdalncntals 3, 318.
1-----l
l
;-I*
Table 3. Porous structure
of freeze-dried gels (samples equilibrated
at 52% RH). k (cd
Gel
Starch Gelatin Egg albumen Cellulose gum
Pectin 10% Pectin 5% Pectin 5%-glucose 5%
Porosity
0.93 0.93 0.97 0.89 0.97 0.98 0.96
volume of pores a The ratio : volume of sample
8
Size of pores
Z-10 3-15 3-15 Z-10 l-10 l-10 l-8
(p)
pores of various shapes bundles of fibers across the sample
cm-1 “C-1 set-1) (X IO-“)
0.980 0.987 0.999 1.499 1.133 0.935 1.196
778
THERMAL
CONDUCTIVITY
Hilsenrath, J., et al. 1955. Thermal properties of gases. Natl. Bureau of Standards, Circ. No. 564. Hoge, H. J., and G. F. Fonseca. 1964. The thermal conductivity of a multilayer sample of underwear material under a variety of experimental conditions. Textile Research J. 34, 401. Hoge, H. J., S. S. Eichacker, and G. F. Fonseca. 1962. A guarded hot-plate apparatus for the measurement of thermal conductivity. Quartermaster Research and Eng. Cepzter, Tech. Rept. PR-6, Natick, Mass. Lusk, G., Karel M., and S. A. Goldblith. 1964. Thermal conductivity of some freeze-dried fish. Food Technol. 18, 1625. Luyet, B. J. 1962. Effect of freezing rates on the structure of freeze-dried materials. In: Freeze-drying of Foods. Natl. Acad. Sci.-Natl. Research Count., Washington, D. C.
OF
FREEZE-DRIED
GELS
Nuttall, R. L. 1950. Thermal conductivity of helium. The NBS-NACA Tables of Thermal Properties of Gases, Table 6.42. Saravacos, G. 1965. Freeze-drying rates and water sorption of model food gels. Food Techol. 19, No. 4, 193. Ms. rec’d 3/23/65. Presented at the 25th annual meeting of the Institute of Food Technologists, May 1620, 1965, Kansas City, MO. This work was carried out while the senior author was a visiting scientist at the U. S. Army Natick Laboratories, and the support of the National Academy of Sciences-National Research Council is gratefully acknowledged. The authors thank Dr. Harold J. Hoge, Head, Thermodynamics Laboratory of the Pioneering Research Division, for help and advice throughout.

Related documents

6 Pages • 3,340 Words • PDF • 504.2 KB

108 Pages • 13,884 Words • PDF • 23.3 MB

483 Pages • 178,197 Words • PDF • 15.4 MB

3 Pages • 230 Words • PDF • 1.6 MB

1,125 Pages • 518,896 Words • PDF • 22.8 MB

1,088 Pages • 577,511 Words • PDF • 13.8 MB

131 Pages • PDF • 25.9 MB
14 Pages • 6,133 Words • PDF • 580.8 KB

284 Pages • 81,089 Words • PDF • 6.9 MB

782 Pages • 409,169 Words • PDF • 15 MB

2,538 Pages • 1,051,665 Words • PDF • 23.8 MB

2 Pages • 625 Words • PDF • 688.1 KB